 On the IN-SPIRE main toolbar, click on the Facets
  button, or from the main menubar, select Tools > Facets. The Facets tool opens to show the "Themes" facet.
To look at relationships between calculated themes as well as groups that you have already defined, use the Facets tool. Once groups of terms have been created and sorted into folders via the Groups tool, you can see aggregate data for each group (or focus) within a given folder (or facet) to compare and contrast relationships between groups.
The Facets tool enables you to:
 On the IN-SPIRE main toolbar, click on the Facets
  button, or from the main menubar, select Tools > Facets. The Facets tool opens to show the "Themes" facet.
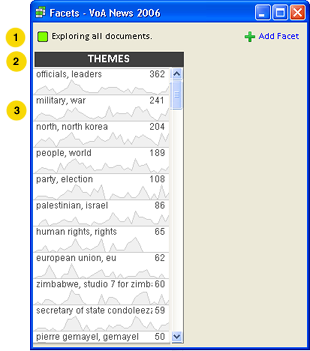
The following numbers correspond to those on the Facets window image (at right).
Facets represent aspects of the dataset. Each facet is a folder in the Groups Tool which can contain groups that are computed by IN-SPIRE or which you have created:
Click the  button in the upper-right corner of the window to add a facet column.
Click on the facet column header to display a list of facets that are as yet unassigned to columns. Select one from the list to replace the current column.

Click on the "x" at the right of the facet's column header.
Use Facets to select the documents you are particularly interested in. Click on a focus that you want to explore.
Repeated selections are very useful if you want to "drill down" to characteristics that several facets (groups of documents) have in common. If you click on one focus, selecting it, and then click on another one, both will be selected. All of the documents that are in both foci will be selected. There are no restrictions on which foci, or how many foci can be selected using this process.
To deselect all documents, click the "clear selection" button link at the top of the screen.
Facets is responsive to selections made elsewhere in IN-SPIRE. With Facets open, select the documents. See Ways to Select Documents.
As described above, you can select documents using Facets or elsewhere, and if a document is selected in any tool, it will also be selected in Facets. This interoperability means that you can narrow your focus to just the documents that you think are most interesting, read them in the Document Viewer, create a group of them using Groups, or see where they are plotted in the Galaxy, for example.