![]() Video tutorial available.
Video tutorial available.
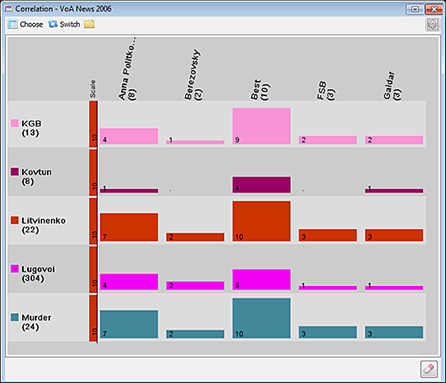
The Correlation tool facilitates concept tracking by showing you the level of correlation (the ratio of common documents) between groups . For example, you can compare themes by geographical area, sources, languages, or one theme by another.
You can see which documents or groups have been selected elsewhere, and select groups or cells from Correlation itself. See Selecting Documents below.
To see a breakdown of ratings by group and by cell, choose Settings > Color by Basic Group Ratings. See Correlation: Group Ratings for details.
 button on the IN-SPIRE main toolbar or choosing Tools >Correlation from the menu, and the Correlation tool window displays.
 Once the Correlation tool is open, you can specify which rows and columns are used by clicking the Choose
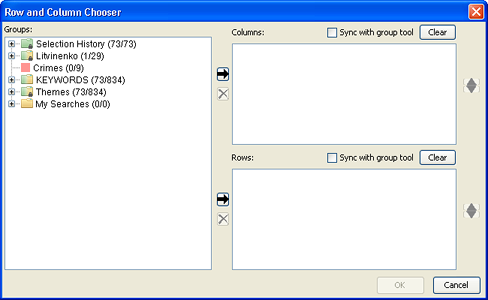
 button to add them to the Columns list.
Choose rows in the same way you chose columns. Highlight groups in the list of Groups on the left, and click the right-arrow button to add them to the Rows list.
Edit the lists if you like by removing groups or reordering them:
 .
.
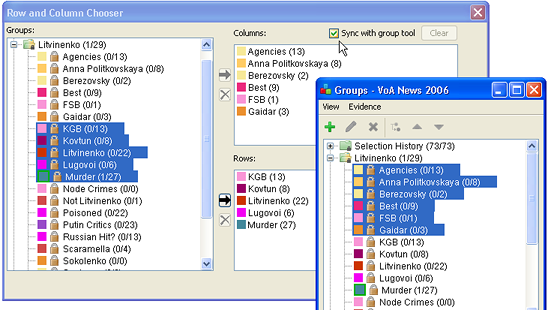
Another way of organizing the matrix is to make the groups highlighted in the Groups tool actually drive the rows, the columns, or both rows and columns in Correlation by syncing them with the Groups tool. Which groups are displayed and the order of the groups in Correlation will then depend solely on which groups are highlighted in the Groups tool and their order. To sync rows or columns with the Groups tool:
You can add a group to a row or column in Correlation by dragging it from the Groups tool onto the Correlation window. If you have a Correlation set up already, this is a convenient way to add a group. You can even specify where in the order you want to place it. If there are no rows or columns in Correlation yet, drag and drop will not be enabled.
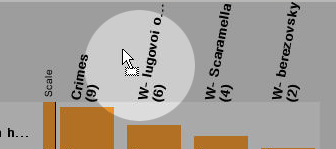
Column order is set in the Row and Column Chooser. Row order may be set in the Row and Column Chooser, but it is also possible to reorder rows in the Correlation window itself by dragging and dropping. To drag and drop a row to a new position in the order, click and drag on any of the cells in the row. The row becomes dragable and will be grayed with a dotted line around it. Drag the row to its new position.
 If rows are sync'd with the Groups tool, drag will not be available. Clicking and attempting to drag will merely resize the row height.
Keeping a consistent order can be helpful if you have a large number of groups and are using another tool in conjunction with Correlation that keeps them in the Groups tool order. Choose Settings> Groups Order. This option orders the groups that you have chosen in the Row Column Chooser or by dragging and dropping. It does not sync the rows or columns with the Groups Tool. See Syncing Rows and Columns with the Groups Tool.
Choose Settings> Correlation Order. The matrix is rearranged so that similar rows and columns are closer together.
Clicking a cell in the correlation matrix makes that cell's members the Current Selection. The selected cell in the matrix will be highlighted green. The Correlation Tool honors the same hotkeys as other visualization tools for selecting items from a visualization. The selection highlight in Correlation is responsive to changes in the current selection made elsewhere in IN-SPIRE.
Selection highlights in Correlation will also change if:
To Select All Documents in a Row or Column, click on a row label to select all cells in that row. Similarly, clicking on a column header will select all cells in that column.
You can read selected documents in the Document Viewer and see their relationships to each other and to unselected documents in the Galaxy.
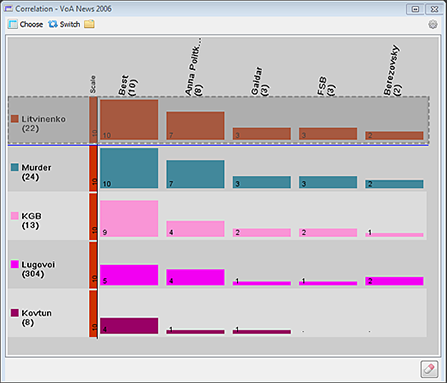
By default, the height of the histogram bars in Correlation cells is proportionate to the cell in the matrix that contains the largest number of documents. To the left of every row is a color bar that is the color of the group to which the largest cell belongs and the number of how many members are in that cell.
When the number of documents per cell varies greatly, if cell contents show absolute numbers it can be difficult to compare cells having just a few members. Instead, compare the proportion of documents in the cell to the number of documents in the row, so that the number of documents in the row group determines the bar height rather than the largest group in the whole matrix. Choose Settings> Normalize.
The vertical color bar at the left of each row changes to the row group color and the number on that bar shows the number of documents in the row group.
In the image above, the cell that has 9 members is the largest. Of the several cells having that number, the first one encountered when the matrix is computed is KGB x Best.
A label showing the number of documents in each cell will be visible by default in cells large enough to accommodate it. Turn these labels on or off by choosing Settings> Document Counts.
To adjust the cell size to fit in the Correlation window, choose Settings> Optimize Cell Size. The height and width of the cells in the matrix will be adjusted to be as large as possible while showing as many cells as possible in the window.
Shortcuts enable you to save the row groups, column groups, and their order. Shortcuts that are supplied are: Save As, Manage Shortcuts, and Switch Rows & Columns. Save As allows you to save this correlation with a Shortcut Name. Manage Shortcuts allows you to Load, Rename or Delete saved shortcuts. Switch Rows & Columns exchanges the row groups with the column groups and vice-versa. .