Lexical Analysis: Distribution
If you are concerned with the extremes of the distribution of lexical scores, the lower 25% and the upper 75%, the Distribution visualization will be more helpful than the mean scores. You can compare, for example, whether the documents in a particular group are more negative than those in the data set as a whole, or more negative than documents in a set of other groups.
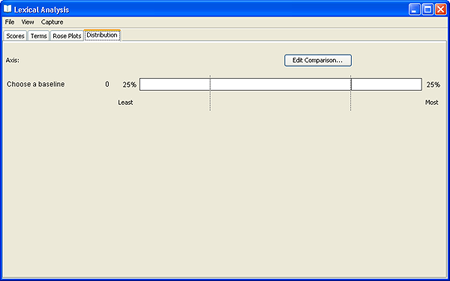
On the Lexical Analysis window, click on the Distribution tab. If you have never set up a comparison for the present dataset, the screen will appear like this:

Setting Up a Comparison
Elements
- Axis: One axis from a lexicon. The "English Five Pairs" lexicon, for example, has 10 axes.
- Baseline: The collection of documents against which the other groups will be compared. By default, this is " All documents," but it can be the documents in any group or groups that you choose.
- Comparison groups: The groups of interest, which you want to compare to each other and to the Baseline.
Steps
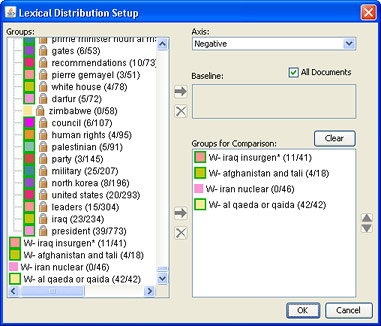
- On the Lexical Distribution panel, click the Edit Comparison... button. The Lexical Distribution Setup window opens.

- Choose an Axis by selecting one from the Axis dropdown list. If the lexical content of documents has not been measured, this list will be empty. In that case, click Cancel to close the Lexical Distribution Setup window and measure with the selected lexicon.
- Choose a Baseline. This is the group or groups against which you want to compare the others.To choose All Documents, select the checkbox; to choose any of the groups listed at left, select them, then click the -> button to move the selected items into the Baseline list. If you select several groups, statistics for all of the documents in the groups will be computed and displayed as the Baseline.
- Choose groups for comparison in the same way that you chose groups for the baseline. Highlight them in the list at left and then click the arrow to move them into the Groups for Comparison list. To remove a group or groups from these lists, simply click on it to select and then click the Delete
 button.
- Use the up and down buttons to the right of the Comparison Groups list to order the list however you'd like.
- Click OK.
Understanding a Comparison

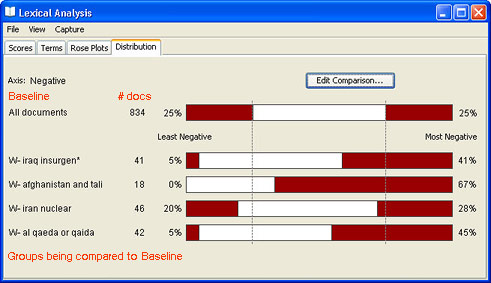
In the comparison that is shown here, the baseline is "All Documents" and the groups created from searches are being compared with it (and with each other). The histograms help you to identify outliers or groups that are discrepant from the rest. In the example, the "afghanistan and taliban" group, the preponderance of the documents are more negative than documents as a whole, which is true of the "iraq insurgen*" and "al qaeda or quaida" groups as well, less so of "iran nuclear" which is only slightly more negative than all documents.
To see the changes in lexical content in a population over time
Create sub-groups at intervals from the main group and then visualize them using Lexical Distribution.
- Create a group of interesting documents.
- In the Groups tool, highlight only that group or groups.
- Open the Time Tool.
- Click on the Groups button.
- Display bar graphs rather than line graphs, for ease in selection. Choose View > Bar Graphs.
- Adjust the sliding time window in the bottom panel to display the time period you are interested in in the upper panel.
- To select only the documents in a group in a particular time segment, hover the cursor over the bar that represent them. The magenta highlighting shows you that those documents are the potential selection. When the magenta highlighting encompasses the documents you want to select, click. The documents will be selected (that bar will now be green).
By contrast, if you want to select all documents in a particular time period, regardless of which of the highlighted groups they are in, hover the cursor over the date. Notice that the magenta highlighting is now a vertical rectangle which extends across all groups. Click to select all documents that are highlighted magenta.
- Go back to the Groups tool and create a new group from the selected documents.
- Repeat for each time period in which you are interested.
- Set up your comparison in Lexical Distribution such that the time sub-groups are ordered chronologically, so that it is easier to see the progression of changes, if there are any.
If the Time Tool is "Filtering Time"
 Lexical Distribution is responsive to the Time Tool. If the Time Tool is filtering time (Time Tool > Time > Filter Time) , then the comparison will reflect the distribution of lexical scores in the active time period (the time period in the upper panel of the Time Tool). These documents will also be those that are visible in the Galaxy.
Other Representations of Lexical Content Scores


 button.
![]() Lexical Distribution is responsive to the Time Tool. If the Time Tool is filtering time (Time Tool > Time > Filter Time) , then the comparison will reflect the distribution of lexical scores in the active time period (the time period in the upper panel of the Time Tool). These documents will also be those that are visible in the Galaxy.
Lexical Distribution is responsive to the Time Tool. If the Time Tool is filtering time (Time Tool > Time > Filter Time) , then the comparison will reflect the distribution of lexical scores in the active time period (the time period in the upper panel of the Time Tool). These documents will also be those that are visible in the Galaxy.