button, or select Tools > Time.
Datasets whose documents contain a date field (defined when the dataset was created) can be analyzed using the Time tool. The Time tool examines the relationships between document topics and time, allowing you to visualize those changes on a graph.
The Time tool has the ability to update the Document Viewer, Galaxy, ThemeView, and ThemeView Classic depending upon the menu settings selected.
On the IN-SPIRE main toolbar, click on the Time button, or select Tools > Time.
The Time tool allows for visualizing time-based data either across the entire range available within the dataset or within specific date ranges. The units of time used by these date ranges are configurable via the Time Units button. The Time tool has four views: Documents, Groups, Terms, and Flows. The interface for navigating time ranges within all four views is the same.
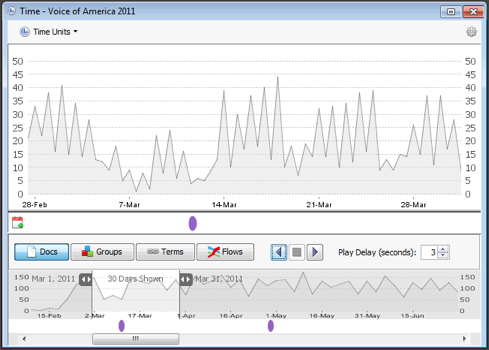
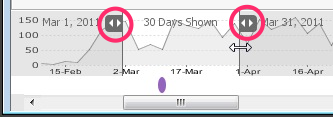 The lower panel of the Time Tool allows for selecting a portion of the date range available within the data set by clicking and dragging the gray handles to expand or contract the light gray selection area. Double-clicking on one of the handles maximizes its extent. In other words, double-clicking on the left handle sets the left side of the range to the time of the earliest document in the dataset. Double-clicking on the right handle sets the right side of the range to the time of the latest document.
The graphs displayed in any of the four views may be switched between Line and Bar Graphs via the Settings menu options.
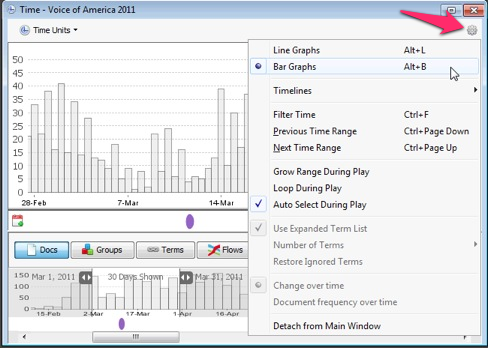
In addition, the Settings> Previous Time Range and the Settings> Next Time Range menu options will scroll the time range selected in the lower part of the window as appropriate.
 The Time tool supersedes the TimeSlicer and makes one of TimeSlicer's confusing features an option: It does not automatically filter the documents displayed in the Galaxy. Turn on filtering by choosing Settings> Filter Time.
As with any other visualization tool within IN-SPIRE, the Time tool honors the keyboard shortcuts detailed within selecting items from a visualization. The "Clear Selection" options in other portions of IN-SPIRE will also clear selections from the Time tool.
It is not possible to select date ranges within the "All Docs" row at the top of the Groups and Terms views.
By default, the Time tool will select and use a time unit that maximizes the amount of information per unit of time and minimizes user scrolling. The recommended units are shown in the drop-down menu opened by clicking the Time Units button. You may override the view granularity by selecting your own preferred unit. Note that the tool may not necessarily be able to render certain preferred units if the dataset does not contain that level of time granularity.
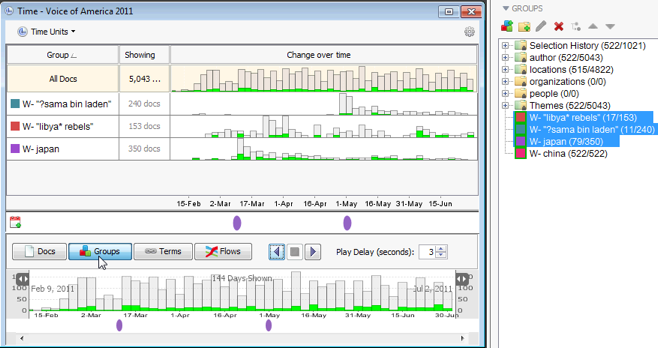
The Groups view shows a histogram for each of the groups highlighted in the Groups tool. The histogram shows "Change over time" by default which is a view normalized to that group's highest value. If you want to see how the values compare to the maximum value of the dataset, choose "Document frequency over time" from the Gear menu. As with other views, changing the time range shown in the lower portion of the tool will update the document frequency and number of term matches appropriately.
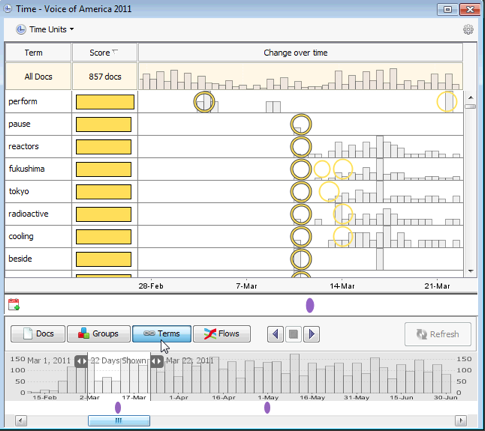
The Terms view shows term frequency for the selected time range via a relevancy score and frequency graph for each term in the range. The Terms view also shows "temporally interesting" circles, which calculated surprise and emergence scores over a period of time. See Surprise Term Filtering for more details. As with other views, changing the time range in the lower panel will update the document frequency and relevancy scores in the upper panel.
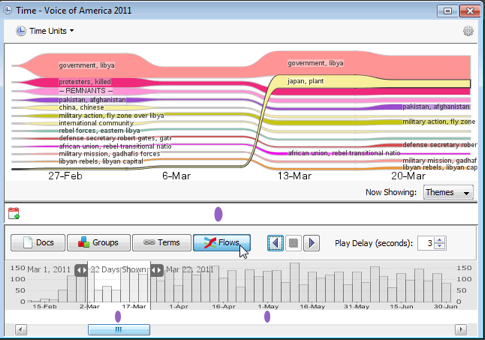
The Flows view shows documents frequency for groups within a group folder (or facet) selected from the "Now Showing" list. Groups are represented as flows across distinct time periods and are sorted by their overlap with the current selection in each time period. The height of each flow within each time period reflects the number of documents in that group that occur within that time period. The darker inner bands reflect the portion of documents within the group that are represented by the current document selection. When the document selection changes, the positions of group flows will change as their overlap with the selection changes.
By default, the Time tool will select and use an additional time unit for the Flows view. When the Flows view active, its recommended units are shown in the drop-down menu displayed by clicking on the Time Units button. You may override the view granularity for the Flows view by selecting your own preferred unit when the Flows view is active. Note that the tool may not necessarily be able to render certain preferred units if the dataset does not contain that level of time granularity.
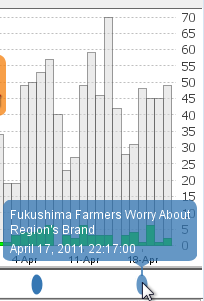
Timelines allow you to pin events to the Time tool. Events can be created by hand or by adding a document's title and date information to the timeline. Multiple timelines can be shown, and timelines can be hidden by using the Time tool gear menu. Timelines are a great way to see where real-world events line up with your data, or to see where specific documents are located in time. For more information, see the article on Timelines.