You are here: Tools > Lexical Analysis > Lexical Analysis: Rose Plots
Lexical Analysis: Rose Plots
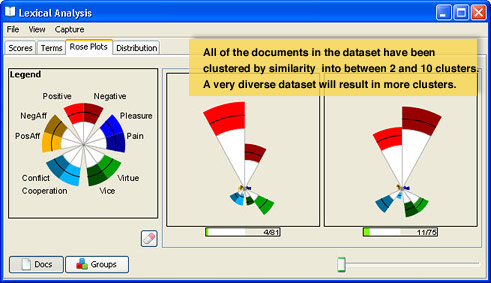
Rose Plots show the relationship between lexical scores on all axes in the lexicon simultaneously. Documents in the dataset and documents in highlighted groups are characterized by clustering documents by similarity.
Docs
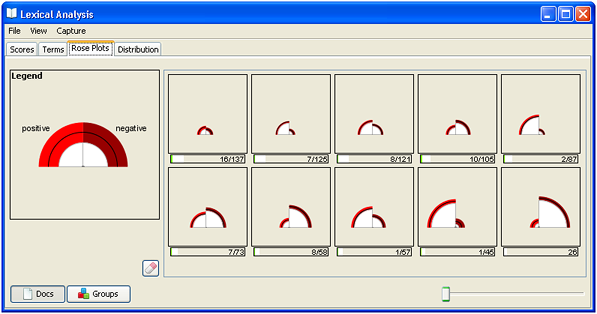
This image shows the rose plots for the English Five Pairs lexicon.
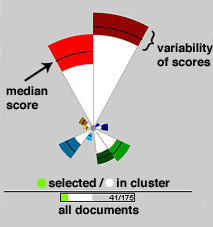 Each cluster of documents having similar scores
is represented by a "rose plot" having "petals". A
pair of axes will consist of a positive (the lighter, brighter colored
petal) and a negative (the darker colored petal). Here the Positive and
Negative axes are paired so both are shades of red and are plotted adjacent
to each other. The colored portion of each petal indicates the scores
that fall within the 25th to 75th percentile of scores on that axis, while
the line inside the colored area represents the median score.
Each cluster of documents having similar scores
is represented by a "rose plot" having "petals". A
pair of axes will consist of a positive (the lighter, brighter colored
petal) and a negative (the darker colored petal). Here the Positive and
Negative axes are paired so both are shades of red and are plotted adjacent
to each other. The colored portion of each petal indicates the scores
that fall within the 25th to 75th percentile of scores on that axis, while
the line inside the colored area represents the median score.
One can gauge the lexical scores of a group through comparing both the median
of the axes as well as the size of the petals. In the example at left,
we can see that overall the documents in this cluster are more negative
than positive. On the example Docs panel on the left, we see that documents for this dataset cluster into
just two clusters, one more negative and the other more positive. The
number of clusters is directly related to the amount of variability in
the lexicon scores in the collection, so it is significant here that there
are only two of them.
If documents are selected, the number falling into one cluster or the
other is represented by the bar graphs at the bottoms of each of the cluster windows.
To Select Documents by Cluster
To select documents by cluster so that you can see where they occur
in the Galaxy, read them in the Document Viewer, etc., click on the rose
plot for the cluster. To select more than one cluster, hold down the CTRL
key as you click on the rose plot for each one you want to select.
The rose plot visualization will have a petal for each axis in the chosen lexicon.
Groups
To understand how the lexical content of one group of documents differs from
another, using the Rose Plots:
- Create one or more groups.
- In the Groups tool, highlight the groups.
- On the Lexical Analysis window, click on the Rose Plots tab.
- Click the Groups button at the bottom of the Lexical Analysis window. Rose plots for the highlighted groups appear.
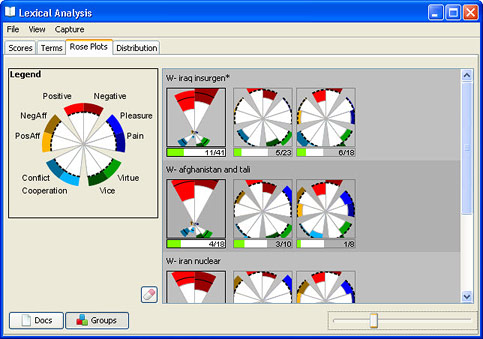
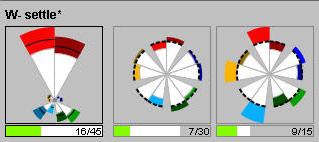
As you can see in the above example, there are two different types
of rose plots (or glyphs) in the Groups view. The first glyph is like
those in the Docs view and shows the "main effect", while the second type of glyphs following show the
deviations from expected scores for the group, or the "residual" scores.
You can select all of the documents portrayed in a glyphs simply by clicking on it. The square will acquire a green border and the green measure below it will show which proportion of the documents are selected. The rose plots will also reflect selections made elsewhere in IN-SPIRE, such as in the example above. Of the documents in this group, 10 have been selected (10/46 below the first glyph), and all 10 of them are in the first "residual" (10/23 below the next glyph, green histogram).
Residual Rose Plots
 While the first (left-most) glyph for each group represents
the main effect, the other glyphs for the group represent the deviations
from expected scores for the group, or the "residual" scores.
The expected scores are simply those scores that represent the overall distribution of scores.
While the first (left-most) glyph for each group represents
the main effect, the other glyphs for the group represent the deviations
from expected scores for the group, or the "residual" scores.
The expected scores are simply those scores that represent the overall distribution of scores.
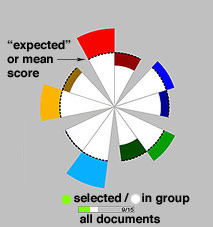
The dotted lines around the circle represent the "expected"
scores for the group. Color above the dotted line indicates the scores
greater than the expected value on that axis, and color below the dotted
line represents the scores that are lower than expected for the group
on that axis. The size of the colored area represents the magnitude of
deviation. In the plot at left, we see that all of the positive axes have
scores above expected, and all of the negative axes have scores at (Conflict)
or below (all the others) expected values.
Analyzing the residual plots for a group can tell you about the composition
of the lexicon scores for the group as a whole. In the following example,
if we look at the "W. settle*" group, we see that although the
main effect is that the group is more positive than negative, if we look
at the residuals, we see that the majority of the Positive score depends
on the high, above-expected Positive scores of a minority of the documents
in the group (15 out of a total of 46).
In the "W - iran nuclear" group, positive and negative scores are evenly split.
 Comparing one group's residual glyph with another group's residual glyph is not meaningful.
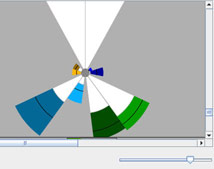
Zooming in for a Closer Look
To adjust the level of detail (zoom in or out of the rose plots), use
the slider at the window's lower right corner. Move the slider to the right to increase the size of the plots, and
to the left to decrease them. Being able to zoom is particularly helpful
when one cluster's extremely large values force the other clusters to
be very small and hard to see. Zooming is also helpful if the large values for one or more axes make the proportionally small values on other axes difficult to compare.
Other Representations of Lexical Analysis Scores