Lexical Analysis: Charged Terms

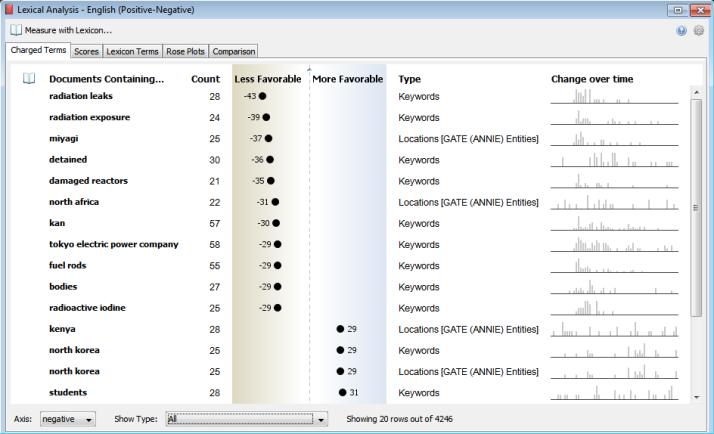
The Charged Terms panel of the Lexical Analysis tool provides a quick way to see the most charged keywords, extracted entities, and highlighted groups for a given axis of the measured lexical axis. This is a great tool to use during your initial exploration of a dataset to find keywords or entities you may not have previously considered.
Basic Usage and Quick Tips
Note: You must first measure with a lexicon in order to use this tool.See "Lexical Analysis: Basics"
Once a lexicon has been chosen and used for a measurement, the Charged Terms tab will automatically populate using the default Axis for that lexicon and the default or last-used settings.Documents are measured using all available documents as the baseline.
- Columns can be sorted by clicking on the column header.
- Clicking on a row highlights it.
- Double-clicking a row selects the documents the term occurs in.
- Use the Shift and Control keys to highlight more than one row at a time.
- Right-click on one or more rows to perform various selection, focus, and group options.
- Use the Axis selector at the bottom of the window to show the terms relative to that axis.
- Use the Show Type selector to show a specific type (keyword, entity, or group) or All types.
- Change the thresholds for showing terms in the Gear menu.
Column Descriptions
- The book icon column indicates that the term is included in the measured lexicon. Terms found in the lexicon will have a check mark in the column. In the example below, "attack" is a term in the English Positive-Negative lexicon file, in the Negative axis. The phrase "security forces" is not present in the lexicon file.

- Documents Containing... is the column that shows the term being measured. The term can be a single word or a multi-word phrase. The label for this column is called "Document Containing [the term]" because what is being measured is the documents the term is a member of. The type of term is determined by the Show Type selector at the bottom of the window. Terms can be keywords (the same keywords used to create Themes), extracted entities (if present in the dataset), or highlighted groups.
- The Count column indicates in how many documents the term was present. This allows you to know how many examples of the term were measured in order to create the score. A minimum number of documents can be set in the gear menu
 .
.
- The middle column shows the score of the documents containing the term as measured against the active set of documents in the dataset. This is display is just like the one used in the Comparison tab. The labels at the top of this column come from the lexicon's XML file. The numerical scores range from -50 to 50. Scores can be turned off (showing just the dots) in the gear menu
 .
.
- The Type column appears when the "Show Type" selector is set to "All". This column indicates if the term is a keyword, group, or entity. If the "Show Type" selector is set to something other than "All," the Type column will not be visible, as all of the terms would be of the same type.
- Change Over Time shows a sparkline view of the documents represented by the term and their distribution over time. As with other sparklines in the system, the bar graph can be changed to a line graph in the Settings menu. If the dataset has no date information, this column will be titled Contribution and will show a filled bar indicating the number of documents as compared to the total set of documents.
Charged Terms Settings

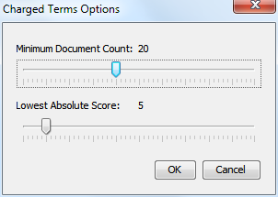
Choose Charged Terms Options from the Lexical Analysis gear menu  to bring up the dialog.
Minimum Document Count uses the number in the Count column to filter the number of terms shown in the visualization. This value will change depending on your familiarity with the performance of the lexicon used. Some are only valuable when more than a minimum number of documents have been assessed. As the slider is moved the visualization will update dynamically.
Lowest Absolute Score uses the -50 to 50 scale of the scores in the middle column. With some lexicons, the only interesting results are the ends of the spectrum. Raising this value reduces the number of items with scores around the center (zero) of the view. The number is absolute. For example, a setting of 10 would filter out terms who's score is -8 as well as scores of positive 8. As the slider is moved the visualization will update dynamically.
When either of these settings are active (i.e. above zero) a message will appear at the bottom of the window indicating how many terms are being shown out of the total.
Other Representations of Lexical Scores


 .
.
 .
.
 to bring up the dialog.