The Comparison tab lets you see if the documents in a particular group are, for example, more negative than those in the data set as a whole, or more negative than documents in a set of other groups. If you have created groups based on time, the Trends view visualizes the changes.
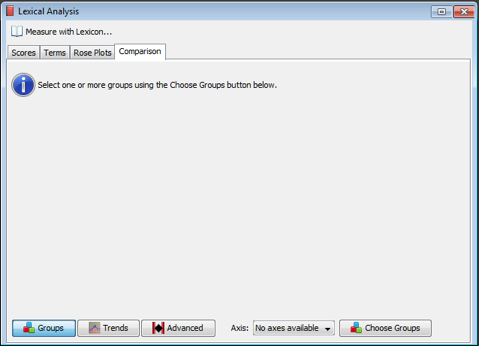
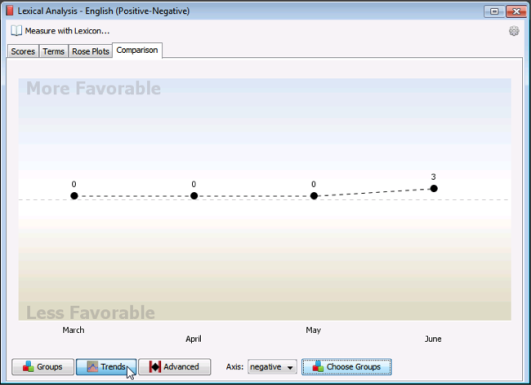
On the Lexical Analysis window, click on the Comparison tab. If you have never set up a comparison for the present dataset, the screen will appear like this:
The bottom of the Comparison section has three buttons used to choose which type of view you would like to see. Use the Groups view when you have created groups of documents not in a specific time series. Use the Trends view when your groups are organized by time. Use the Advanced view when you want to see the specific numbers used in the calculation. (Please note that prior to IN-SPIRE 5.6, Advanced view was called Distribution.)
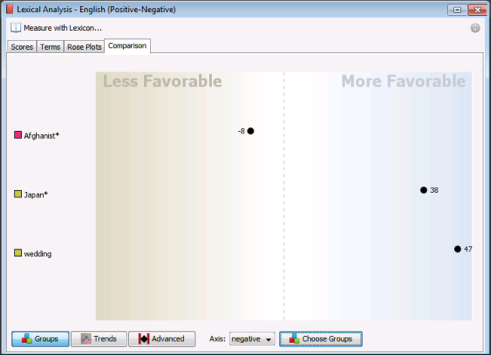
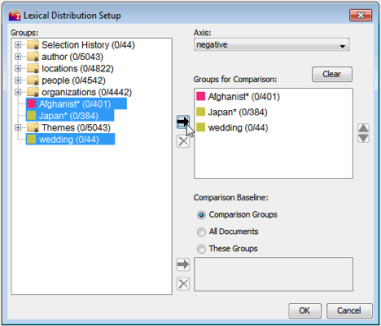
In the comparison shown here, the baseline is "All Documents" and three groups created from searches are being compared with it (and with each other). The dots and scores indicate the strength of the chosen axis with calculated values greater than zero on the blue side, and values less than zero on the tan side. Since the axis in this example is "Negative", we can state that in this dataset, the terms used in the documents about Japan are less negative (more favorable) than documents about Afghanistan, and terms in the documents about weddings are much less negative.
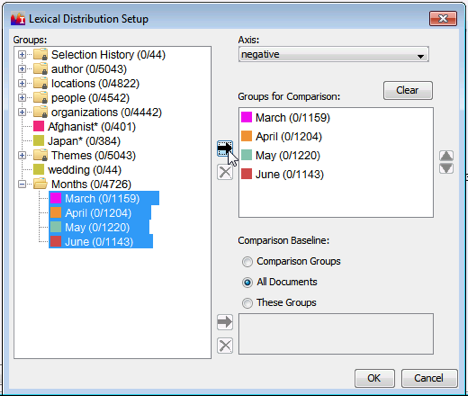
Create sub-groups at intervals from the main group and then visualize them using Lexical Distribution.
Another method to creating time-based groups is to use the Time Search method to make time bins of the entire dataset, then use the Overlap Selection button at the bottom of the Groups tool to make new selections that can be saved as new groups.
Once you have time-based groups, use the Trends view to see them on the red/green visualization with connecting lines to help you see the change in the selected axis over time. The groups will be arranged in the order specified in the Choose Groups window.
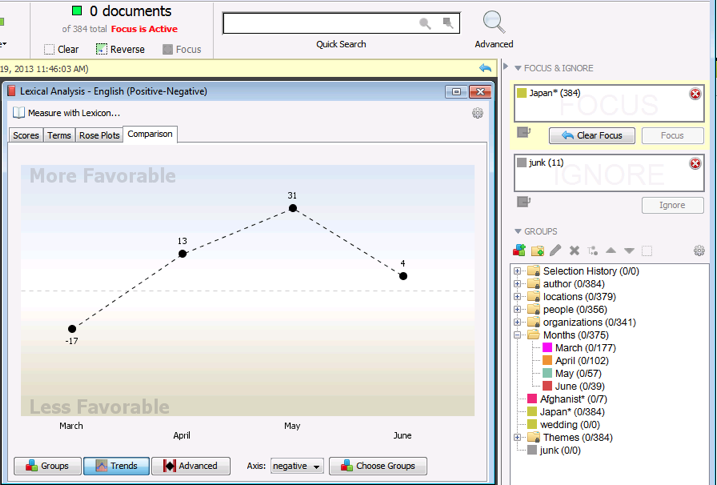
Setting Focus to a specific topic and them measuring with a lexicon is a powerful way to see trends across time. The Trend screenshot above is not very interesting because news stories on the whole don't change their level of negativity month-to-month. Here's the same visualization with the Focus set to a search on Japan* (note the Tsunami hit in March 2011)
![]() Lexical Distribution is responsive to the Time Tool. If the Time Tool is filtering time (Time Tool > Gear Menu > Filter Time) , then the comparison will reflect the distribution of lexical scores in the active time period (the time period in the upper panel of the Time Tool). These documents will also be those that are visible in the Galaxy.
Lexical Distribution is responsive to the Time Tool. If the Time Tool is filtering time (Time Tool > Gear Menu > Filter Time) , then the comparison will reflect the distribution of lexical scores in the active time period (the time period in the upper panel of the Time Tool). These documents will also be those that are visible in the Galaxy.
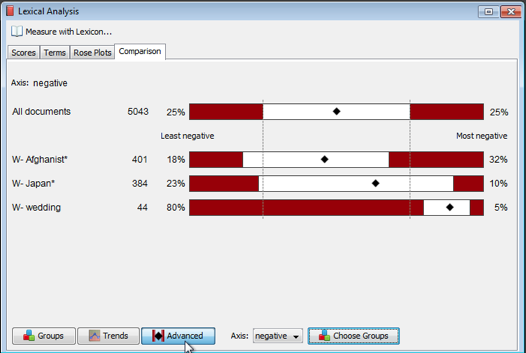
If you are concerned with the extremes of the distribution of lexical scores, the lower 25% and the upper 75%, the Advanced view will be more helpful than the mean scores. This view shows how the inner and outer quartiles of lexical scores of each group compare to the baseline group. This might help you identify skew of a group towards lesser or greater amounts of negativity compared to the baseline. You might also identify polarization of negativity in comparison to the baseline which would be displayed as large red blocks for the upper and lower quartiles.
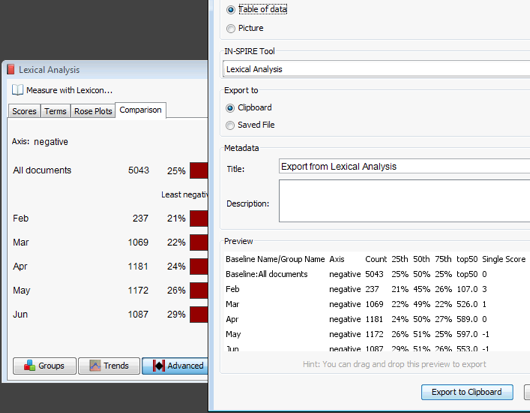
All of the numbers needed to perform your own detailed calculations of affect in the data can be saved from the Export tool. Choose Table of Data, and make sure the IN-SPIRE Tool is set to Lexical Analysis.