Lexical Analysis Scores plots all of the documents in the dataset, or all of the documents in a group, in order by lexical score, with the lowest score at left and highest score at right. They are color-coded into as many as five "bins".
To see the lexical distribution for the dataset as a whole, regardless of which groups are highlighted or documents selected, click ![]()
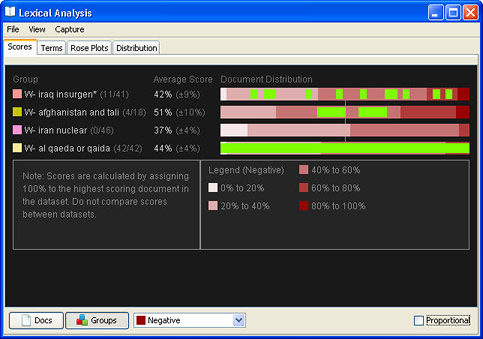
To compare lexical scores for groups highlighted in the Groups tool, Click ![]() .
.
All of the axes in the active lexicon (the one last used for measurement) are available in the dropdown menu  . By default, if the "Negative" axis is present in the lexicon, it is selected.
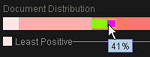
Lexical scores for all documents in the dataset are ordered by magnitude and plotted with the lowest scores at left (the lightest pink) and the highest scores at right (the darkest red). Each of the five bins comprises 20% of the scores: 0% to 19%, 20% to 39% etc., relative to the largest score.
Any selections will be colored green. The width of a single selected document varies according to the number of documents in the dataset or the group in which it appears. In large datasets, a single green line will represent several documents.
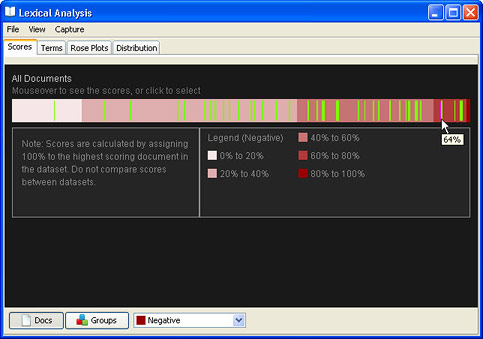
To discover the score of the document at a certain location relative to the highest score of any document in the dataset, mouse over the bar and after a short delay a tooltip will appear with .
![]() The document at the far right is always 100%, but if there are a large number of documents, you may not be able to find the single highest-scoring document by mousing over it. Sorting by Score in the Document Viewer will help you find the highest-scoring document.
The document at the far right is always 100%, but if there are a large number of documents, you may not be able to find the single highest-scoring document by mousing over it. Sorting by Score in the Document Viewer will help you find the highest-scoring document.
While in the Scores tab, it is possible to use the shortcuts detailed within selecting items from a visualization on the histogram to review documents in the Document Viewer.
To select documents from this view, click and drag along the bar.
After you release the mouse button, the area over which you have dragged will replace the current selection. You can also select a subset of a selected section, and add or remove from a selection.
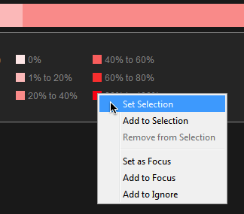
Documents can also be selected by right-clicking on the legend under the histogram.
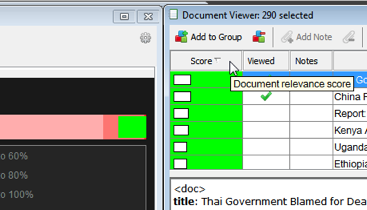
When a set of documents are selected from the Document Distribution display, the Document Viewer's Score column will update to show the relative score for each of the selected documents. Sort by this column to see the highest-scoring documents in the selection.
Clicking the Groups button displays the lexical scores of highlighted groups. If there are only a few documents in a group (as there are in "W-iraq insurgen*)", a single selected document will be plotted as a rectangle rather than as a vertical line.
The numbers in the "Score" column show the average score for the group followed by the margin of error. For example, for "W-iraq insurgen*" the average score is 39% (of the maximum possible score) and the margin of error is ±5%. In other words, the true score is somewhere between 34% and 44%.
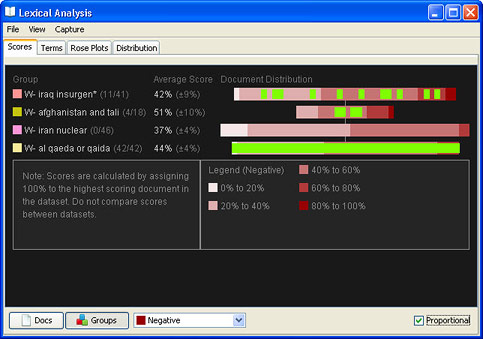
The Proportional checkbox only applies to the Groups view. By default it is checked. When Proportional is checked, the length of each bar will be proportional to the number of documents in the group, relative to the number of documents in the largest highlighted group. The center point of each bar is the average score for the group.