The sidebars contain tool panels that assist with global functionality. To show or hide sidebars, select View> Show Left Sidebar or Show Right Sidebar. Checkmarks will display when sidebars are shown. You can also hide or show sidebars by clicking along the inside edges of the sidebars. Each panel within the sidebars can be shown or hidden by clicking on the title of the component.
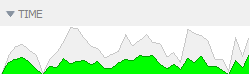
The Time panel displays a graph showing the distribution of documents throughout the entire dataset over time. For datasets such as Google or Web, the Time display will be blank.
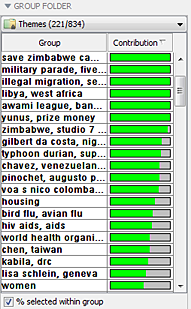
From the drop-down list at the top, choose which folder to use, or highlight one or more groups in Groups and drag them to this panel. Highlights of groups visible here are kept synchronized with Groups. If highlights in Groups change but none of the highlighted groups are visible here, no changes will be seen.
The contents of the listed groups are expressed as numbers (or percentage) of documents compared to the largest group (gray) and the numbers (or percentage) of documents that are selected (green). Choosing percentage normalizes the histograms, which helps when group size varies considerably between the listed groups. The number of documents in a large group can overwhelm a small group and make it difficult to see.
A right-click menu is available to make selecting groups easier:
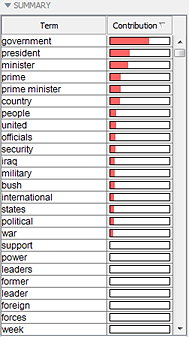
The Summary panel lists the major terms in the selected documents and their contribution (weight). If you select the Auto summarize option from the Settings menu, it will automatically summarize the selection when it changes. If your selected documents are changing frequently, deselect Auto Summarize, so you won't have to wait for the Summary to run.
A right-click menu is available:
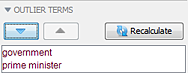
The Outlier Terms panel allows you to remove unimportant terms and stop them from having an influence on the Galaxy. Terms from Summary can be moved to Outlier Terms. See Removing Unhelpful Themes for more details.
You can also use the Major Terms tool in a similar manner. See Major Terms.
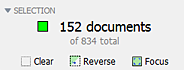
The Selection panel provides a single global summary of selection by displaying the total number of documents selected and the total document count in the entire dataset. Selection includes three functions:  ,
,  , and
, and  .
.
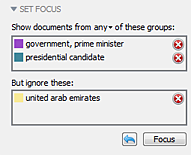
Focus is a component that acts like a global filtering system. Focus has the ability to filter a set of documents from all tools of IN-SPIRE without having to create a new dataset. See Sidebars: Focus.
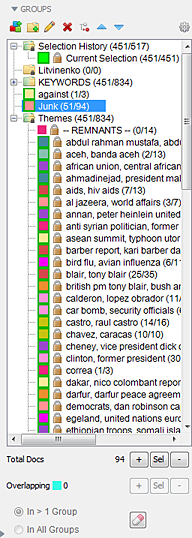
The Groups panel defines a collection of documents (a group) within your dataset. Groups can also be used with Focus. See Sidebars: Groups.
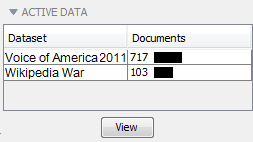
The Active Data panel functions with the Active Data Tool by listing datasets in a current project, matching documents count, and the strength of those matches. See Active Data for more detail.