You are here: Getting Started > Getting an Overview of a Dataset
Getting an Overview of a Dataset
IN-SPIRE's Galaxy, ThemeView Classic
and Facets are good places to start when you want to get an overview of a dataset. Documents in both visualization tools are plotted with respect to their similarity on multiple dimensions so that proximity implies relatedness, and both visualizations have the same
spatial arrangement.
-
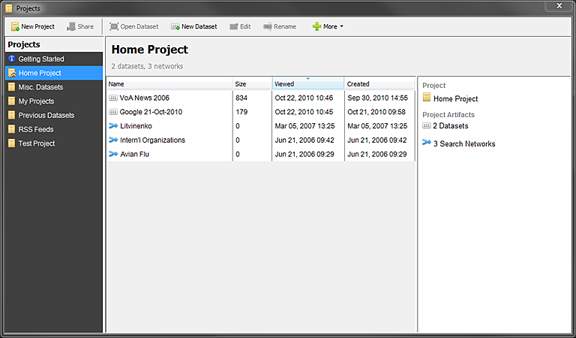
Open a dataset
if one is not already open. To open a dataset,
from the main toolbar choose File > Projects. The
Projects window will appear.
-
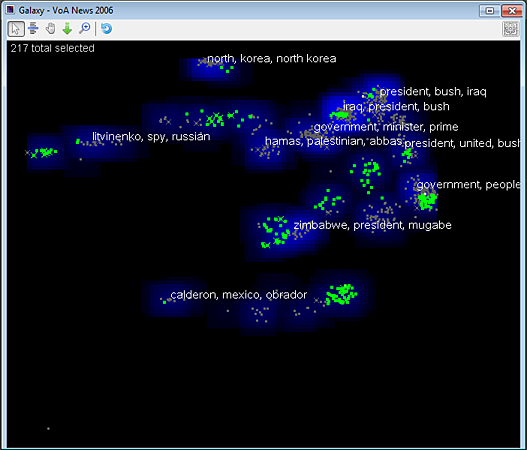
Select a dataset from a project and click  Open Dataset. The Galaxy opens with the dataset's documents plotted in it. Any selections are preserved from the last time the dataset was open.
-
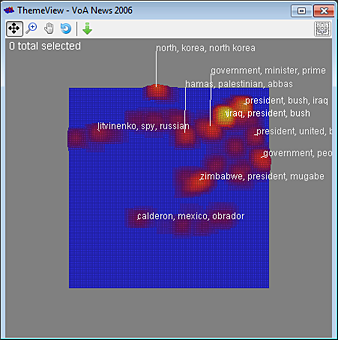
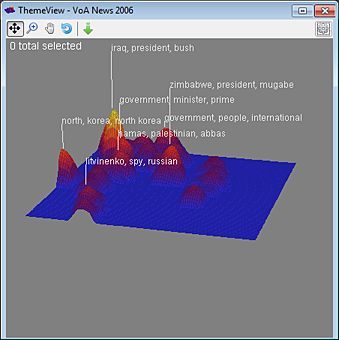
From the IN-SPIRE menu, choose Tools > ThemeView Classic. The ThemeView Classic window opens.
- Click on the
 button to access the Move cursor and use it to adjust ThemeView Classic so your view appears to be 3-dimensional.
-
Find major and minor themes in your document set by comparing the ThemeView peak labels. The higher the peak, the more documents and the stronger the themes it represents. It is likely that Peaks located close together represent related themes. Isolated peaks contain outliers.
 You can control the visibility of Peak Labels. To hide/show Peak Labels, choose Settings
 > Show Peak Labels.
-
The Galaxy's blue ThemeClouds and "Peak Labels" correspond to the ThemeView's peaks and labels. You can control the visibility of both ThemeClouds and Peak Labels; choose Settings> Show ThemeClouds or Settings> Show Peak Labels.
-
To show any strong themes in a location that is not already labeled, use the Probe tool  .
Click on a location in either the ThemeView Classic or Galaxy. Clicking and dragging a circle with the Probe cursor also works.
.
Click on a location in either the ThemeView Classic or Galaxy. Clicking and dragging a circle with the Probe cursor also works.
 Related Topics
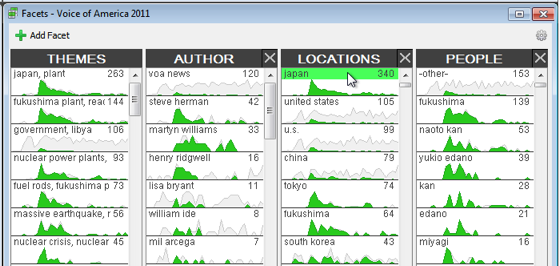
- To look at relationships between calculated themes, categorical fields, entities, and group folders that you have already defined, use the Facets tool
 . Click on any item in a column and the other items in the columns will sort themselves to show their overlap with that item. If your dataset has time information,each item also shows its distribution of documents across the dataset's time range.